matplotlib support
Last modified: September 16, 2022
Contents
Gamera includes optional support for plotting figures using the matplotlib library. If matplotlib is not installed on your machine, Gamera will continue to work normally, but plotting support will not be available.
The matplotlib library provides high-quality plots, including line, scatter, bar, and polar plots, and export of those plots to formats such as PostScript, SVG, PNG or the printer. The list of features is way too long to go into here. This document only describes the bridge between the Gamera GUI and matplotlib. For more information, see the matplotlib documentation.
The connection between Gamera and matplotlib is intentionally minimal, so that it is easy to take advantage of all of matplotlib's functionality and to make it less dependent on any one specific version of matplotlib. If you feel that particular graphs of particular kinds of data in Gamera should be made more convenient, please contact that Gamera authors.
Obtaining matplotlib
Download and install matplotlib following the instructions provided.
There are no special steps to make matplotlib work with Gamera. If it is installed in the default location, Gamera will automatically detect and use it.
Interactive use
Sequences of numbers will appear in the Gamera icon display as one of the following icons:
A sequence of ints. A sequence of floats. A sequence of complex numbers.


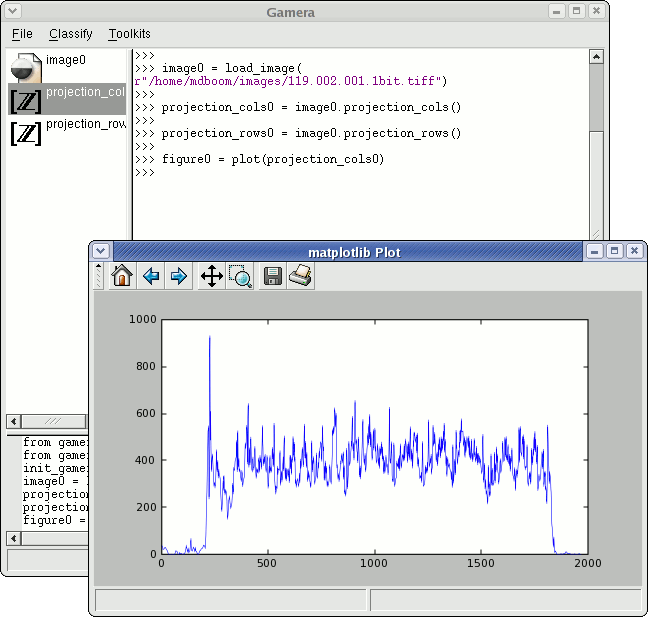
For example, loading an image into the variable image0 and typing the following into the Gamera console, will produce a [Z] icon in the icon display:
>>> projection_cols0 = image0.projection_cols()
Double-clicking a vector icon will plot it using matplotlib in a new plot window. You will be prompted to provide a variable for the figure. (This figure instance can be used to modify the plot).
Dragging a vector icon into an existing plot will add it to the plot using a line of a different color.
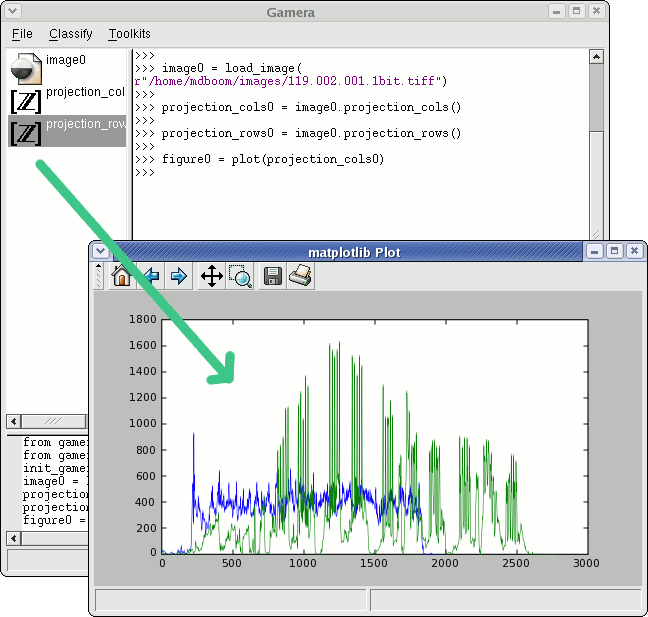
The toolbar buttons in the matplotlib window can be used to modify and then save or print the view. The behavior is the same as for the standard matplotlib viewing windows.
Properties of the figure can be accessed through the figure object returned. For instance, to add a title:
>>> figure0.axes[0].set_title("Projections")
Using matplotlib directly
To move beyond simple line plots, matplotlib can be used directly as described in the matplotlib docs, using the object-oriented or pylab interfaces.
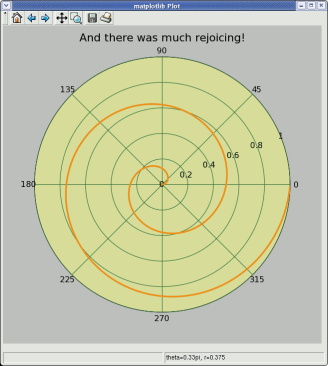
The following example uses the pylab interface and is taken directly from the matplotlib example plot_demo.py. This code can either be entered directly into the Gamera console, or imported from a file. This code assumes that either Numeric or numarray is installed.
from pylab import *

# radar green, solid grid lines
rc('grid', color='#316931', linewidth=1, linestyle='-')
rc('tick', labelsize=15)
# force square figure and square axes looks better for polar, IMO
figure(figsize=(8,8))
ax = axes([0.1, 0.1, 0.8, 0.8], polar=True, axisbg='#d5de9c')

r = arange(0,1,0.001)
theta = 2*2*pi*r
polar(theta, r, color='#ee8d18', lw=3)

title("And there was much rejoicing!", fontsize=20)
savefig('polar_demo')
show()
Using Gamera images as a 2D data source
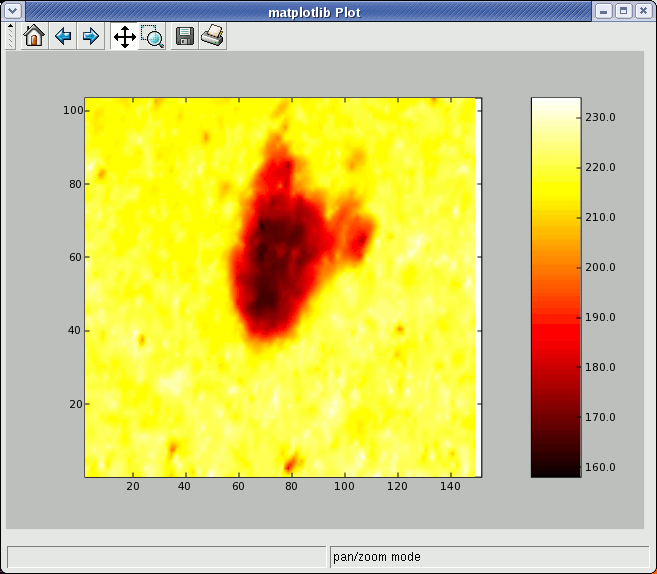
matplotlib can be used to plot 2D images, and it is fairly easy to use Gamera images as a source. Simply convert the Gamera image to a Numeric or numarray array, and then pass that array to matplotlib's imshow function. This functionality is fairly slow, so do not try this on large images.
For example, if you have Numeric Python installed:
>>> arr = image.to_numeric()
Or, if you have numarray installed:
>>> arr = image.to_numarray()
Then pass that array to imshow:
>>> from pylab import *
>>> imshow(arr) # Show image
>>> hot()       # Choose hot colormap
>>> colorbar()  # Show colorbar
>>> show()      # update